Crow Canyon Charts, Dashboards and Reports Add-in
Crow Canyon Charts, Dashboards and Reports Add-in is an Office 365 Add-in to generate custom reports using data from the SharePoint Lists. Reports displays progress of list data graphically based on fields configured.
Overview of Add-in features:
- Supplies the graphs, charts and tables you need to fully analyze the business process and system performance.
- Allows to create graphs, charts and tables based on list from any site in the site collection
- Allows to select two fields from a list to generate reports
- Uses various operators to generate reports – Sum, Count, Max, Min and Avg
- Allows to create both Table and Chart as a Report
- Enables to add any number of reports in Wiki Page/Web part Pages
- Allows to create custom themes to provide borders, padding and spacing to Tables and also colors for charts
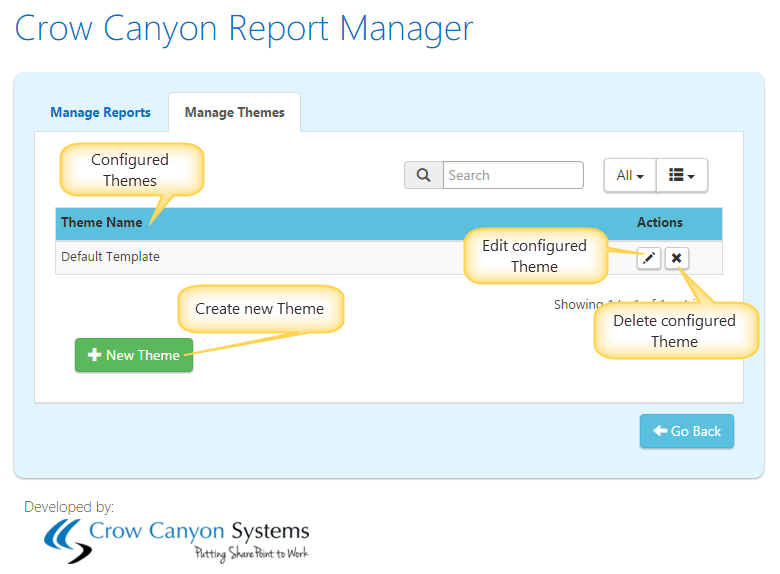
Managing reports functionality
-
Manage Reports
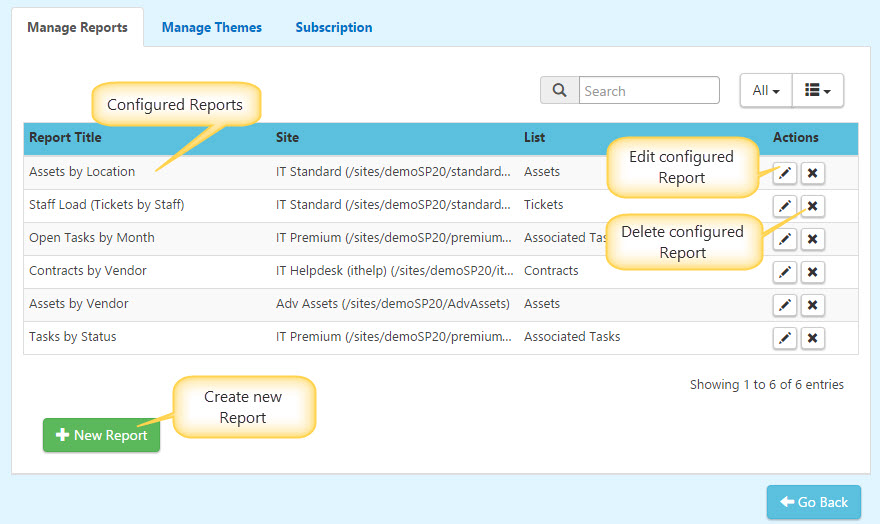
-
Manage Themes
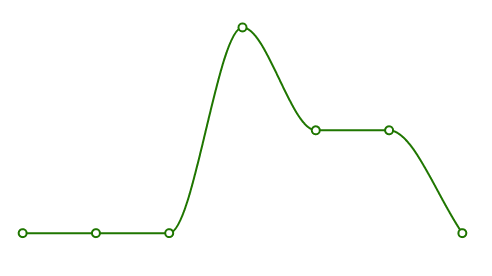
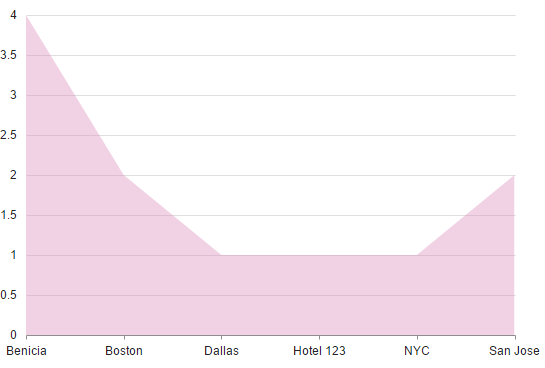
Different Chart Types
-
Line
-
Column

-
Bar

-
Area
-
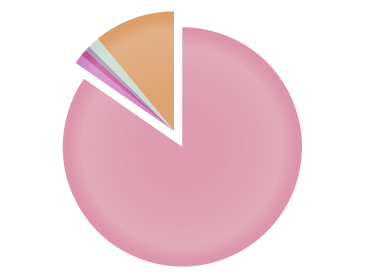
Pie
-
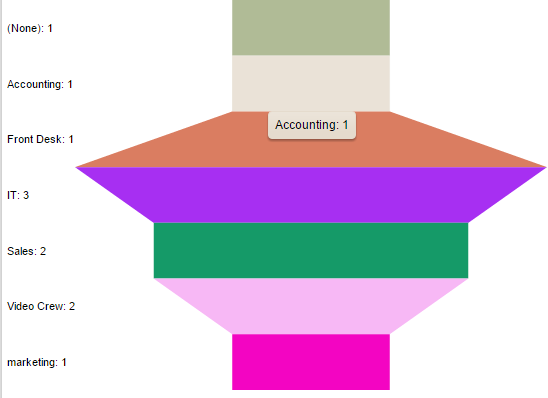
Funnel
Create New Theme
Crow Canyon Charts, Dashboards and Reports Add-in allow you to create custom themes to provide borders, Padding and Spacing to Tables and also to define custom colors for charts.
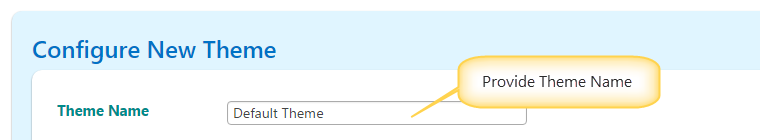
Configure Theme settings as shown below
-
Table Appearance
Table apprearance in Reports can be configured by providing Border, Padding along with Header font colors in the "Table Appearance" Section as shown below

-
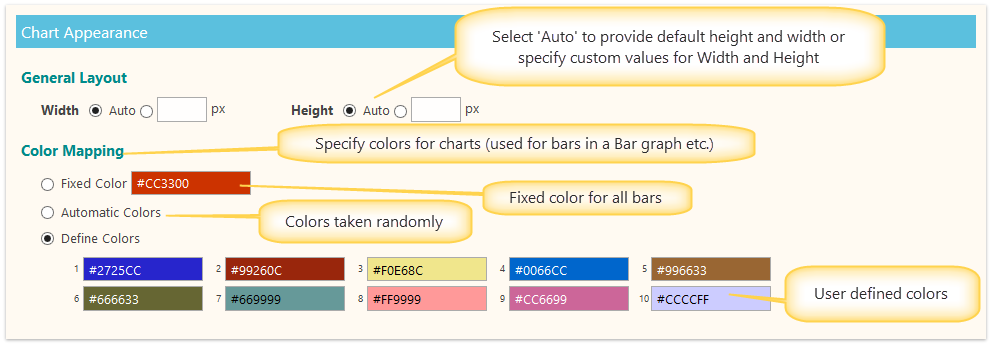
Chart Appearance
Chart appearance can be handled in the ‘Chart Appearance’ section as shown below
Configure Report Center
Report Center is configured to show all the configured reports in a single page.
-
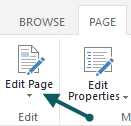
Click "Page" on top left corner of a page on which you wanted to configure Report Center and select "Edit page" as shown below
-
For WebPart Page
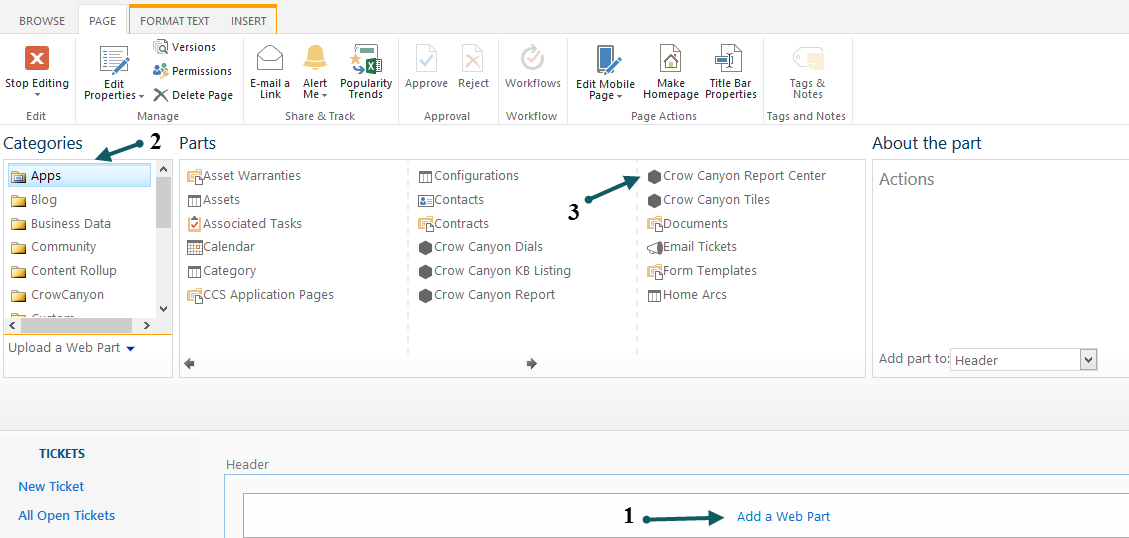
-
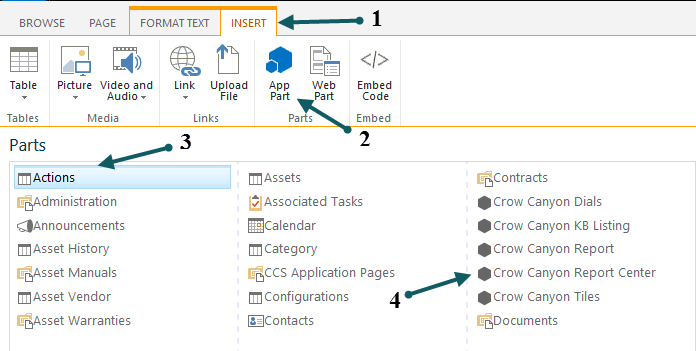
For Wiki Page
-
Add "CCS Quick Launch Hider" on the page to hide quick launch on the page.
-
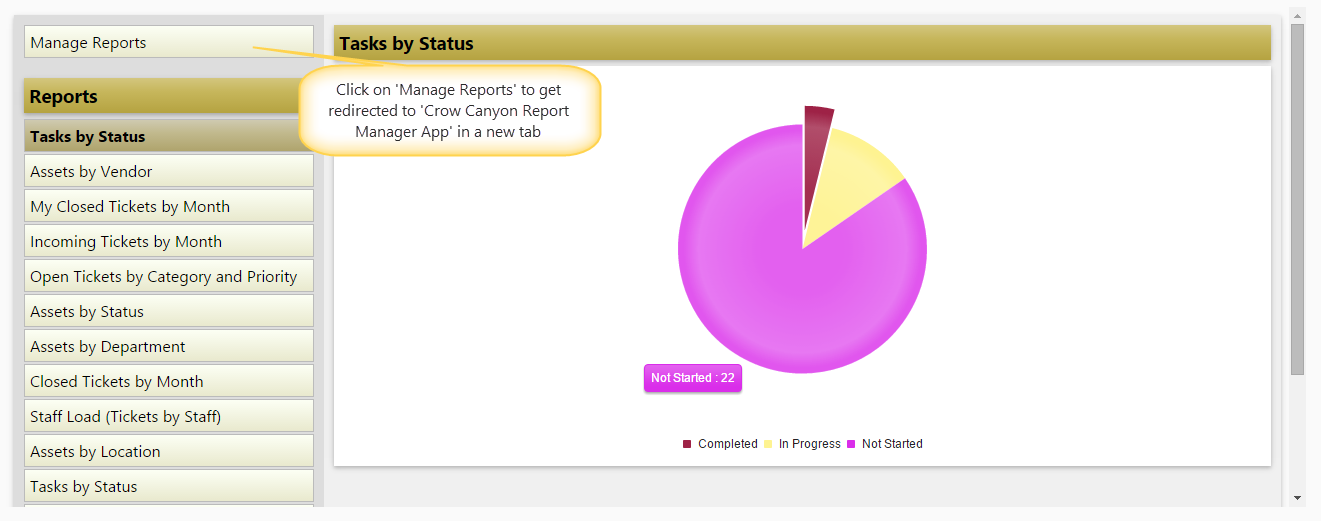
Then you can see Report Center with all the configured Reports as shown below
|